
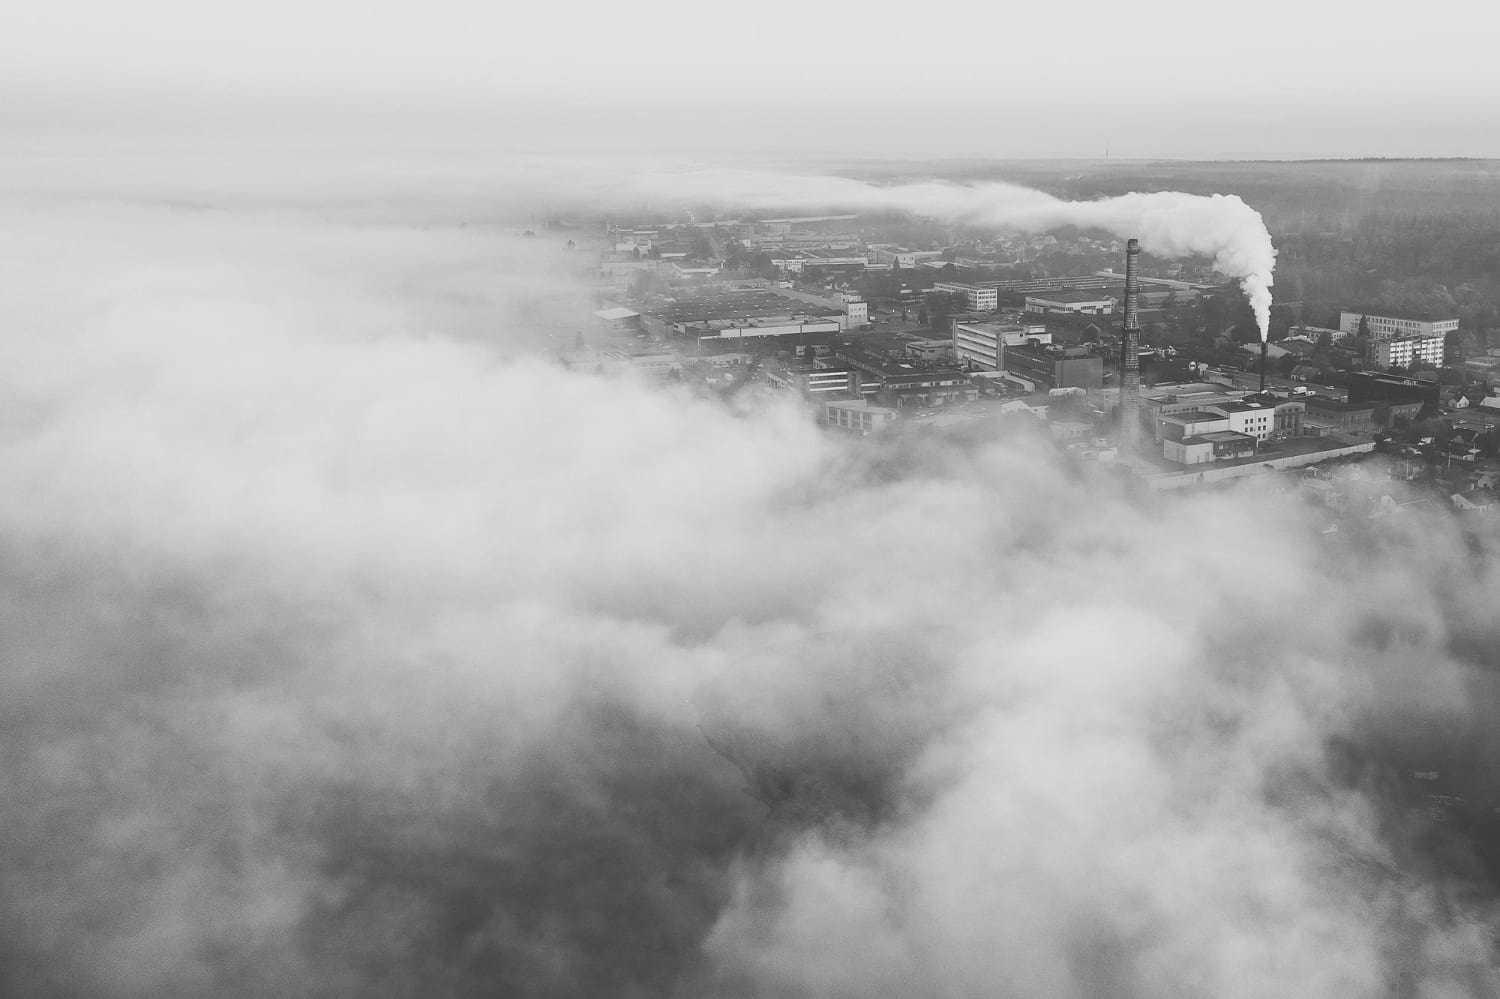
Air pollution is one of the most pressing environmental challenges of our time. It affects human health, contributes to climate change, and impacts ecosystems. Pollutants such as fine particulate matter (PM2.5 and PM10), nitrogen dioxide (NO₂), sulfur dioxide (SO₂), and volatile organic compounds (VOCs) are emitted from various sources, including industrial activities, transportation, and natural phenomena like wildfires.
An air quality map serves as a valuable tool in monitoring pollution levels in real time. By displaying data collected from sensors, satellites, and environmental monitoring stations, these maps allow individuals, governments, and organizations to assess air quality trends and implement appropriate responses. The ability to visualize air pollution geographically enables better decision-making in urban planning, healthcare policies, and personal lifestyle choices.
How an Air Quality Map Works
An air quality map collects and processes data from multiple sources to provide an accurate representation of pollution levels. Advanced monitoring systems use ground-based sensors, satellite imagery, and artificial intelligence to analyze air composition. These sensors measure the concentration of pollutants and transmit real-time data to centralized platforms.
The collected data is then processed using algorithms that convert raw readings into understandable information. Most air quality maps categorize pollution levels using color codes, numerical indices, and graphical overlays. The Air Quality Index (AQI) is one of the most commonly used scales, offering a simple way to interpret pollution levels. It typically ranges from “Good” (low pollution) to “Hazardous” (extreme pollution levels).
Air quality maps are often integrated into weather forecasting systems, allowing users to predict pollution trends. For example, some maps include historical data, enabling comparisons between different seasons, cities, or years. By leveraging machine learning, these systems can even predict pollution spikes based on weather patterns, traffic conditions, and industrial activities.
The Role of Air Quality Maps in Public Health
Air pollution is a silent killer, contributing to millions of premature deaths worldwide each year. Having access to an air quality map empowers individuals to make informed decisions regarding outdoor activities. People with pre-existing health conditions, such as asthma or chronic obstructive pulmonary disease (COPD), can benefit significantly from monitoring pollution levels before venturing outside.
For example, if an air quality map indicates high levels of pollutants in a particular area, residents can take preventive actions such as wearing masks, using air purifiers, or avoiding outdoor exercise. Schools and workplaces can also implement air quality measures by adjusting ventilation systems or scheduling indoor activities on days with poor air quality.
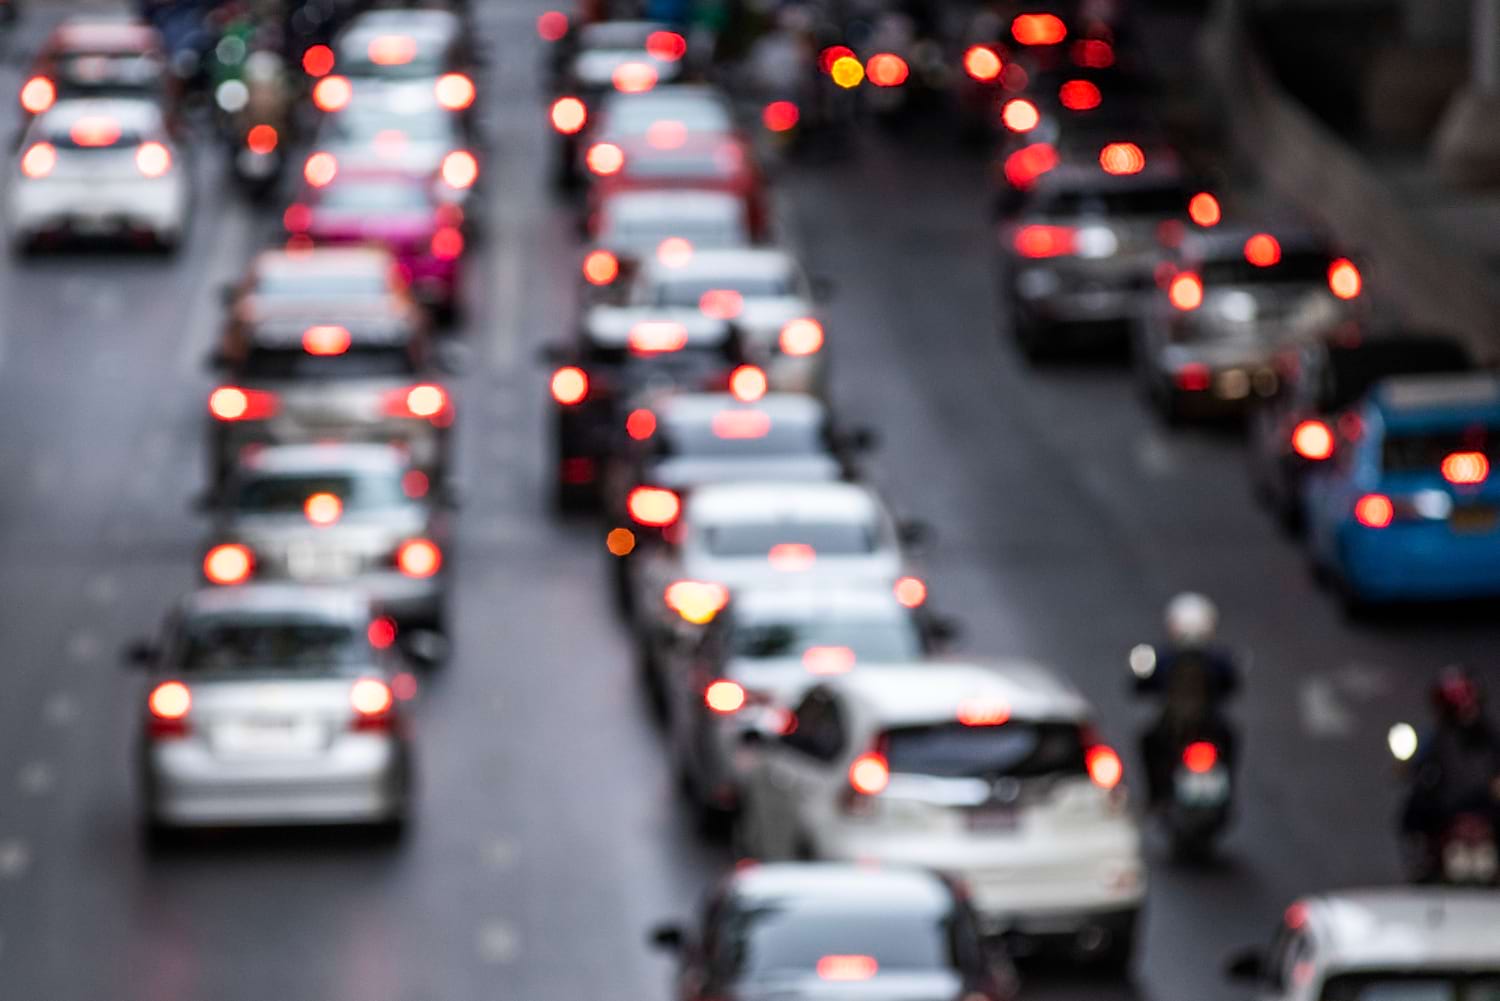
Governments and healthcare institutions rely on air quality maps to develop policies aimed at reducing pollution exposure. By analyzing patterns, authorities can introduce traffic restrictions, implement emission control measures, and encourage the adoption of green technologies. These efforts can lead to significant improvements in overall public health and quality of life.
Air Quality Maps and Environmental Awareness
Raising awareness about pollution is a crucial step toward sustainable living. Air quality maps provide transparency by making pollution data accessible to the public. When people can visualize pollution levels in their area, they are more likely to demand action from policymakers and take steps to reduce their environmental impact.
Educational institutions can incorporate air quality maps into their curriculum, teaching students about the importance of clean air and sustainable practices. Additionally, media outlets frequently use these maps to report on environmental issues, reinforcing the urgency of addressing pollution.
Future Innovations in Air Quality Mapping
Technological advancements continue to improve the accuracy and efficiency of air quality maps. The development of low-cost sensors has made it easier to deploy large-scale monitoring networks in cities and rural areas. Drones equipped with air quality sensors are also being used to gather data in locations that were previously difficult to monitor.
The integration of artificial intelligence and big data analytics allows for more precise pollution predictions. Machine learning algorithms can detect pollution patterns and identify sources of contamination, enabling authorities to take proactive measures. Furthermore, blockchain technology is being explored to enhance the transparency and reliability of air quality data, preventing manipulation or inaccuracies.
As smart cities become a reality, air quality maps will play a fundamental role in urban planning. Governments and businesses will be able to use real-time data to optimize traffic flow, design green spaces, and implement energy-efficient policies. By leveraging cutting-edge technologies, society can work toward cleaner and healthier environments.